Fig. 5
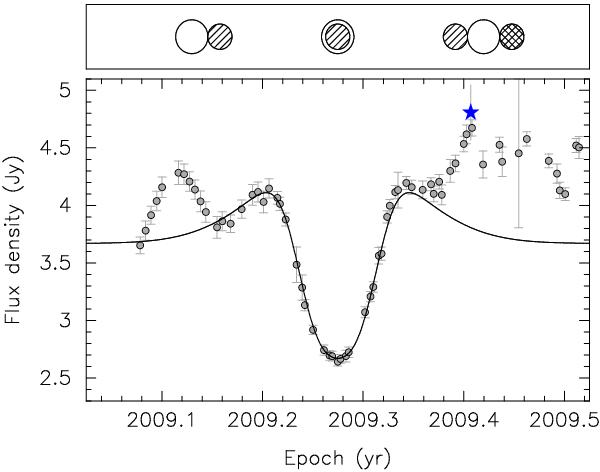
Bottom: 15 GHz OVRO light curve in the quasar 2023+335 during an extreme scattering event. The solid line shows the stochastic broadening model light curve for the ESE. A two-component model was used: a lensed component of flux density 1.87 Jy, and an un-lensed component of flux density 1.80 Jy. The star symbol represents the MOJAVE epoch that revealed multi-component structure induced by refraction (see Fig. 3). This epoch of VLBA observations serendipitously coincided with the local sharp spike, possibly ascribed to the outer caustic that is associated with the passage of the lens edge over the background source. Top: a toy model of the scattering screen during the ESE. The unfilled circle represents the 15.4 GHz VLBA core of the background quasar. The hatched circle represents the lens that passes over the source. The cross-hatched circle represents another electron density enhancement of the screen.
Current usage metrics show cumulative count of Article Views (full-text article views including HTML views, PDF and ePub downloads, according to the available data) and Abstracts Views on Vision4Press platform.
Data correspond to usage on the plateform after 2015. The current usage metrics is available 48-96 hours after online publication and is updated daily on week days.
Initial download of the metrics may take a while.