Fig. 2
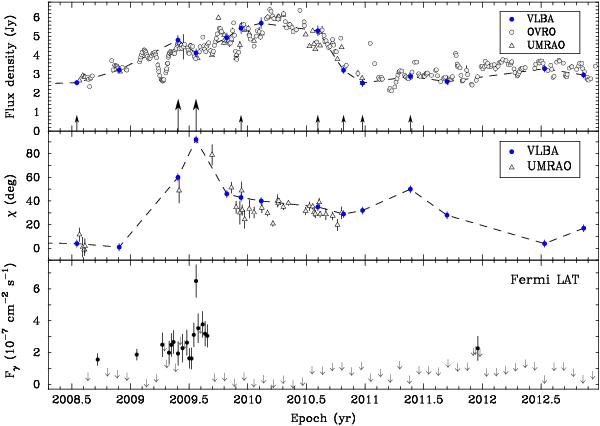
Top: 15.4 GHz total flux density VLBA (filled circles), 15 GHz OVRO (unfilled circles), and 14.5 GHz UMRAO (unfilled triangles) light curves. The epochs of VLBA observations with signatures of multiple imaging (see Fig. 1) are marked by large (strong manifestation) and small arrows (weaker effect) with distinction made visually from Fig. 1 on the basis of the extension of the refraction-induced parsec-scale core sub-structure. Middle: electric vector position angle evolution as measured by 15.4 GHz VLBA (filled circles) and single-dish 14.5 GHz UMRAO (unfilled triangles) observations. Bottom: integrated 0.1−200 GeV photon flux measured with the Fermi LAT. Downward arrows indicate 2σ upper limits.
Current usage metrics show cumulative count of Article Views (full-text article views including HTML views, PDF and ePub downloads, according to the available data) and Abstracts Views on Vision4Press platform.
Data correspond to usage on the plateform after 2015. The current usage metrics is available 48-96 hours after online publication and is updated daily on week days.
Initial download of the metrics may take a while.