Free Access
Fig. 7
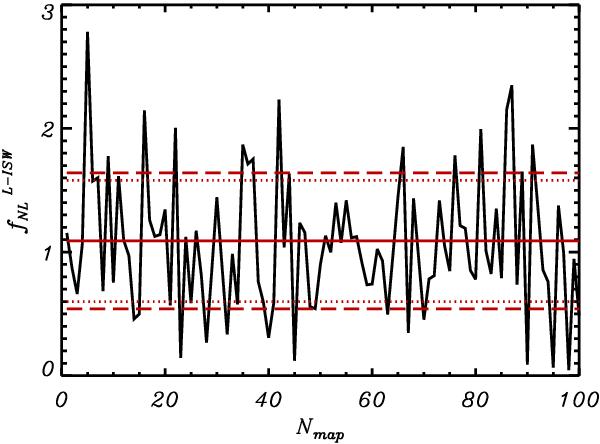
Same as Fig.6 but for a more realistic CMB experiment with a 7′ FWHM Gaussian beam, anisotropic noise, and a 20% galactic mask. Here ℓmax = 1500. The dashed lines are the 1σ averaged error bars from simulations, while the dotted lines are the expected Fisher errors.
Current usage metrics show cumulative count of Article Views (full-text article views including HTML views, PDF and ePub downloads, according to the available data) and Abstracts Views on Vision4Press platform.
Data correspond to usage on the plateform after 2015. The current usage metrics is available 48-96 hours after online publication and is updated daily on week days.
Initial download of the metrics may take a while.