Fig. 5
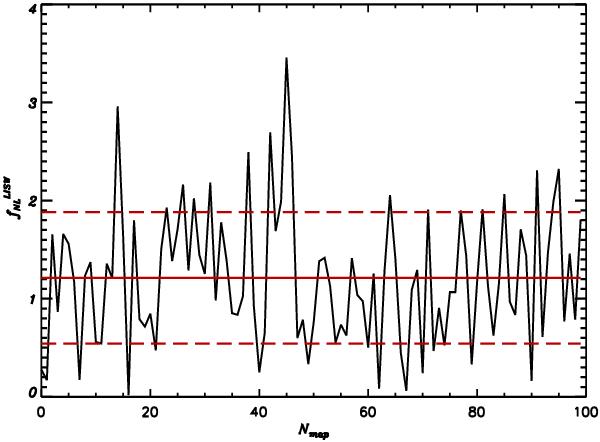
 values for 100 simulated non-Gaussian maps obtained with the covariance method of
Sect. 2.1. The lensing part has been computed
with the FLINTS code (Lavaux & Wandelt
2010). The straight line refers to the averaged
from these simulations, the dashed line to the averaged 1σ error.
Here ℓmax = 1000.
values for 100 simulated non-Gaussian maps obtained with the covariance method of
Sect. 2.1. The lensing part has been computed
with the FLINTS code (Lavaux & Wandelt
2010). The straight line refers to the averaged
from these simulations, the dashed line to the averaged 1σ error.
Here ℓmax = 1000.
Current usage metrics show cumulative count of Article Views (full-text article views including HTML views, PDF and ePub downloads, according to the available data) and Abstracts Views on Vision4Press platform.
Data correspond to usage on the plateform after 2015. The current usage metrics is available 48-96 hours after online publication and is updated daily on week days.
Initial download of the metrics may take a while.