Fig. 4
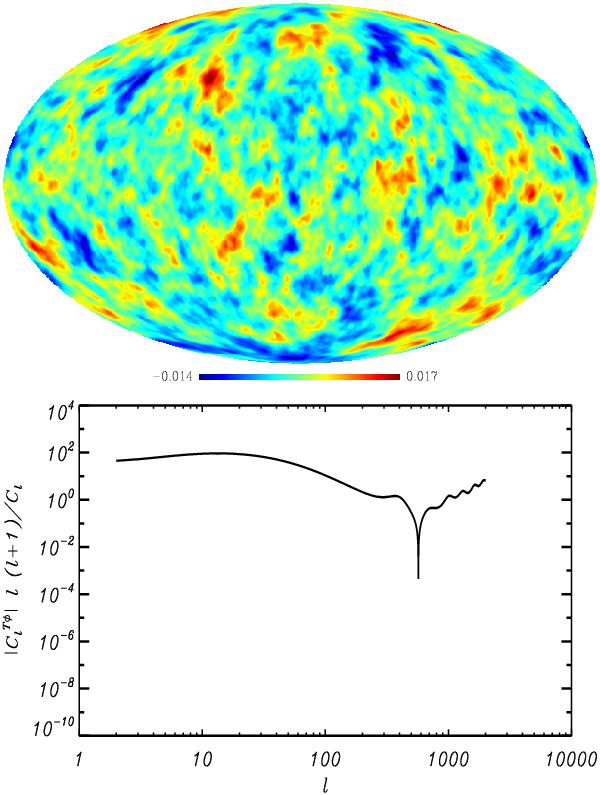
Intermediate-scale contribution to the non-Gaussian L-ISW signal. Same as Fig. 3 but, for the map
 (upper panel) and its corresponding filter
 .
The factor ℓ(ℓ + 1) dominates at high
ℓ, defining more small-scale features than the previous Q map.
.
The factor ℓ(ℓ + 1) dominates at high
ℓ, defining more small-scale features than the previous Q map.
Current usage metrics show cumulative count of Article Views (full-text article views including HTML views, PDF and ePub downloads, according to the available data) and Abstracts Views on Vision4Press platform.
Data correspond to usage on the plateform after 2015. The current usage metrics is available 48-96 hours after online publication and is updated daily on week days.
Initial download of the metrics may take a while.