Free Access
Fig. C.2
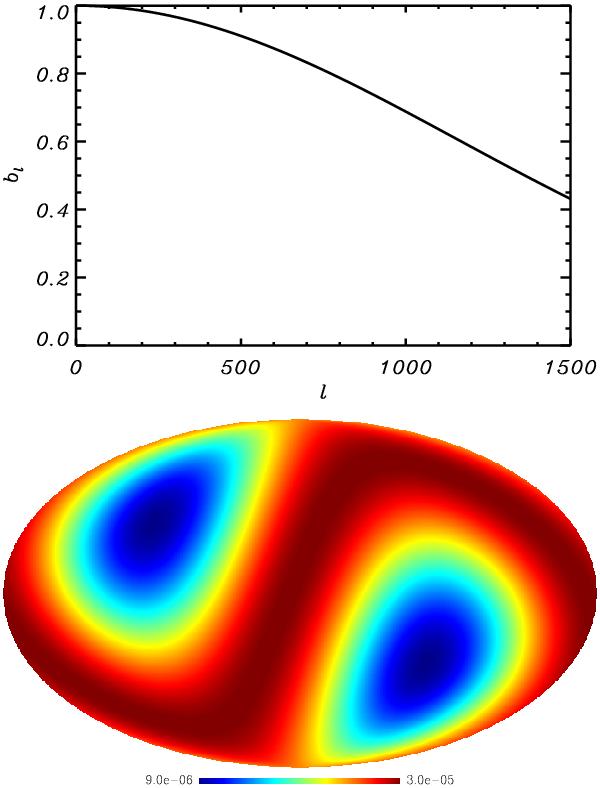
Experimental setting: beam window function and anisotropic noise map. The Gaussian beam with a 7′ FWHM is shown in the upper panel, while the bottom panel shows the dipole-like anisotropic noise covariance matrix map.
This figure is made of several images, please see below:
Current usage metrics show cumulative count of Article Views (full-text article views including HTML views, PDF and ePub downloads, according to the available data) and Abstracts Views on Vision4Press platform.
Data correspond to usage on the plateform after 2015. The current usage metrics is available 48-96 hours after online publication and is updated daily on week days.
Initial download of the metrics may take a while.