Fig. 1
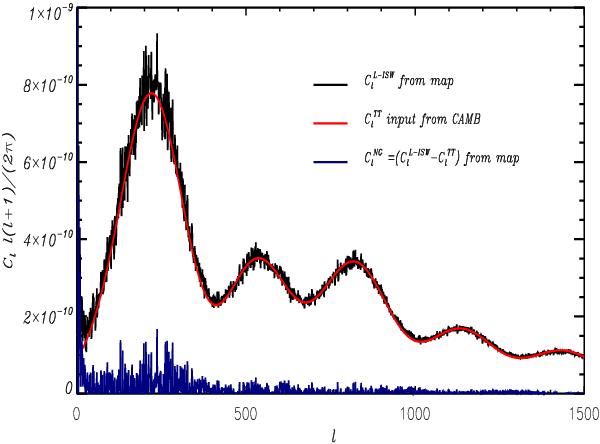
L-ISW power spectrum from the covariance method simulation. The plot shows that the temperature power spectrum of the L-ISW simulations generated with the method described in Sect. 2.1 is compatible with the input theoretical power spectrum from CAMB and that the non-Gaussian contribution is always subdominant. The temperature power spectrum from one simulated L-ISW realization is shown in black, the red line refers to the theoretical input from CAMB while the blue refers to the non-Gaussian L-ISW contribution from the same realization.
Current usage metrics show cumulative count of Article Views (full-text article views including HTML views, PDF and ePub downloads, according to the available data) and Abstracts Views on Vision4Press platform.
Data correspond to usage on the plateform after 2015. The current usage metrics is available 48-96 hours after online publication and is updated daily on week days.
Initial download of the metrics may take a while.