Fig. 8
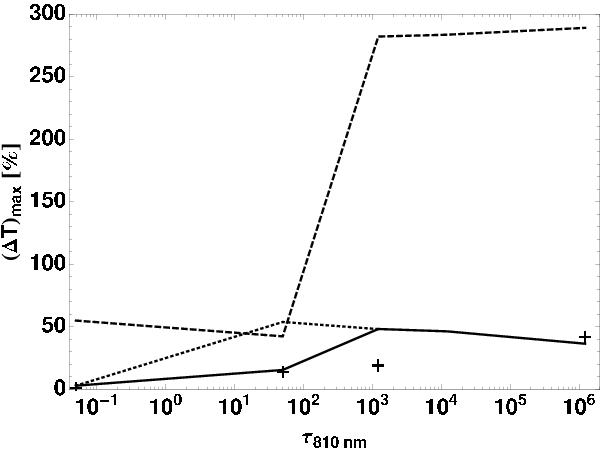
Maximum temperature deviation in the disk’s midplane as function of the optical depth of the circumstellar disk. The solid line denotes the results for the frequency-dependent RT + gray FLD method. The dotted line denotes the results for the gray RT + gray FLD method. The dashed line denotes the results for the gray FLD method. The pluses “+” denote the deviations of the results of the various high-level radiation transport codes used in the original benchmark tests of Pascucci et al. (2004) and Pinte et al. (2009). These values are read off Figs. 4 and 5 in Pascucci et al. (2004) and Fig. 10 in Pinte et al. (2009).
Current usage metrics show cumulative count of Article Views (full-text article views including HTML views, PDF and ePub downloads, according to the available data) and Abstracts Views on Vision4Press platform.
Data correspond to usage on the plateform after 2015. The current usage metrics is available 48-96 hours after online publication and is updated daily on week days.
Initial download of the metrics may take a while.