Fig. 7
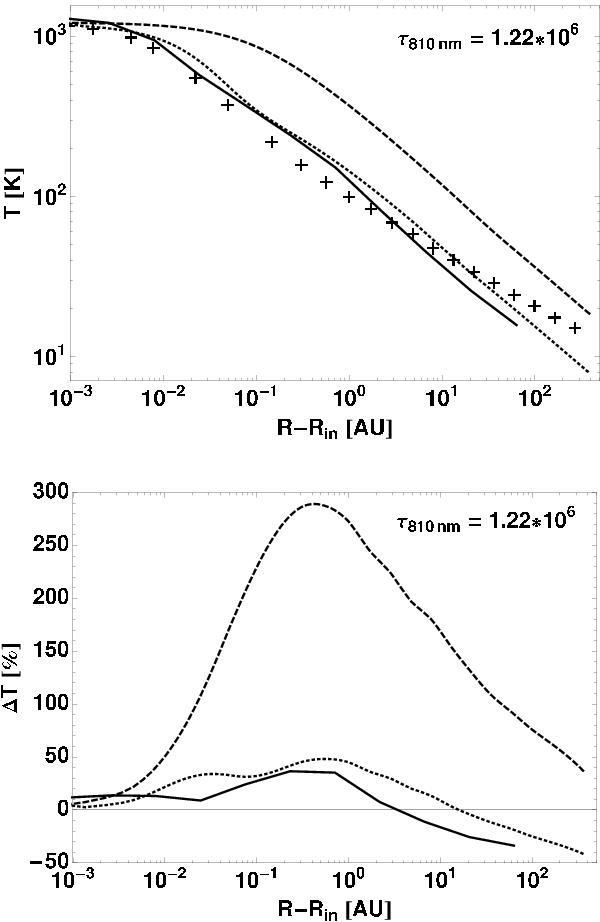
Same as Fig. 3 for simulation runs with τ810 nm = 1.22 × 10⁶. In this highly optical thick case, the results for gray RT + gray FLD are identical to the frequency-dependent RT + gray FLD. Here, the dotted lines represent the results for the frequency-dependent RT + gray FLD method in a low-resolution simulation if an upper limit of the optical depth per grid cell of τmax ≤ 1 is used (see Sect. 3.2 for a description of this numerical trick).
Current usage metrics show cumulative count of Article Views (full-text article views including HTML views, PDF and ePub downloads, according to the available data) and Abstracts Views on Vision4Press platform.
Data correspond to usage on the plateform after 2015. The current usage metrics is available 48-96 hours after online publication and is updated daily on week days.
Initial download of the metrics may take a while.