Fig. 3
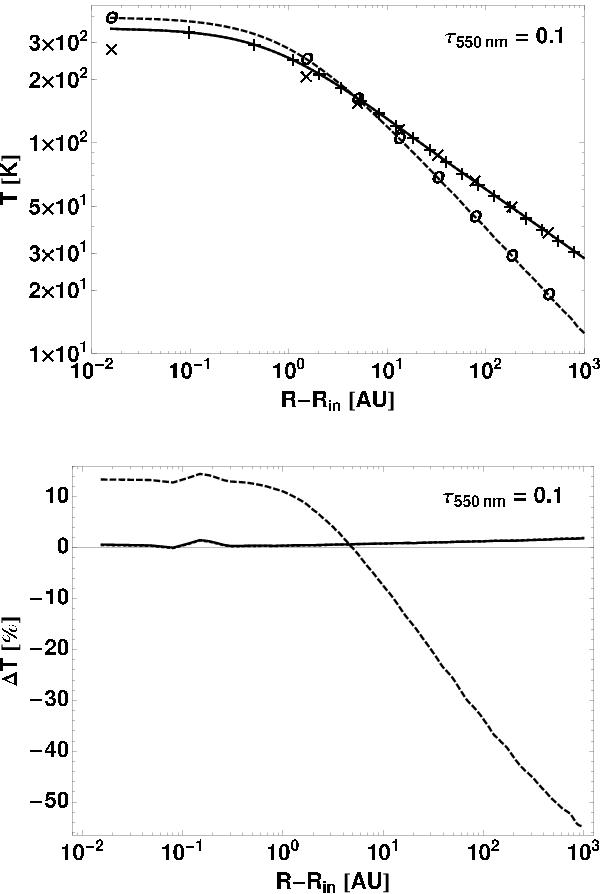
Temperature profiles (upper panel) in the midplane of the circumstellar disk for the case of low optical depth τ550 nm = 0.1. In the lower panel the deviations of the three different radiation transport methods to the comparison code result are displayed. Solid lines denote results for the frequency-dependent RT + gray FLD method. Dotted lines denote results for the gray RT + gray FLD method. Dashed lines denote results for the gray FLD method. Pluses “+” denote results for the comparison code RADMC. In this optical thin case, the results for gray RT + gray FLD are almost identical to the frequency-dependent RT + gray FLD. Here, analytical estimates for the optically thin approximation are given: crosses “×” mark the analytical estimate by Spitzer (1978) for irradiated regions far away from the star, circles “o” mark the analytical estimate in the gray and isotropic approximation (T ∝ r−1/2).
Current usage metrics show cumulative count of Article Views (full-text article views including HTML views, PDF and ePub downloads, according to the available data) and Abstracts Views on Vision4Press platform.
Data correspond to usage on the plateform after 2015. The current usage metrics is available 48-96 hours after online publication and is updated daily on week days.
Initial download of the metrics may take a while.