Free Access
Fig. 3
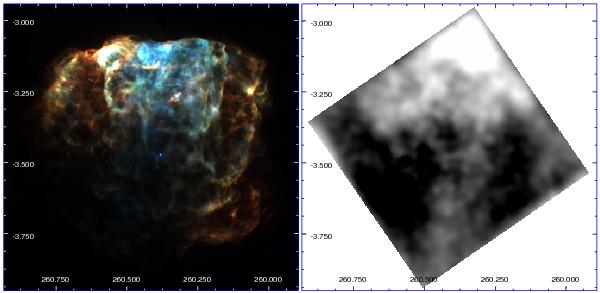
Comparison of the three-band X-ray emission (left) with the distribution of NH integrated between 0 and the systemic velocity of Puppis A (right), presented in Galactic coordinates. Note the central vertical band with higher column density in positional coincidence with the blue fringe in the X-ray image.
Current usage metrics show cumulative count of Article Views (full-text article views including HTML views, PDF and ePub downloads, according to the available data) and Abstracts Views on Vision4Press platform.
Data correspond to usage on the plateform after 2015. The current usage metrics is available 48-96 hours after online publication and is updated daily on week days.
Initial download of the metrics may take a while.