Fig. 1
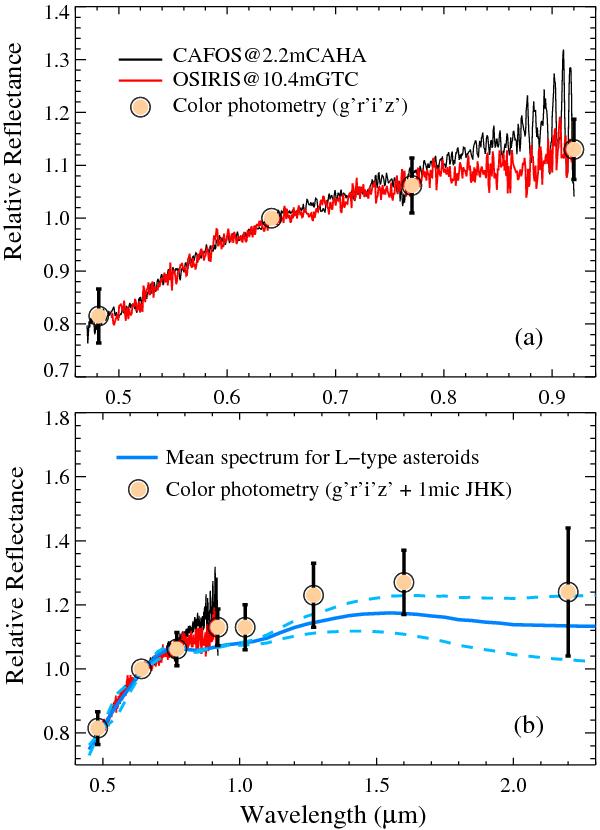
a) Visible spectra of DA14 obtained with CAFOS (black) and OSIRIS (red). Filled circles are the reflectance R values. b) Same as the top panel, but adding the R values for the near-infrared. The mean spectrum of L-type asteroids from DeMeo et al. (2009) is shown in blue. Dashed lines indicate the variation range of this mean spectrum. Both the spectra and the reflectance R are normalized at the central wavelength of r′.
Current usage metrics show cumulative count of Article Views (full-text article views including HTML views, PDF and ePub downloads, according to the available data) and Abstracts Views on Vision4Press platform.
Data correspond to usage on the plateform after 2015. The current usage metrics is available 48-96 hours after online publication and is updated daily on week days.
Initial download of the metrics may take a while.