Fig. 5
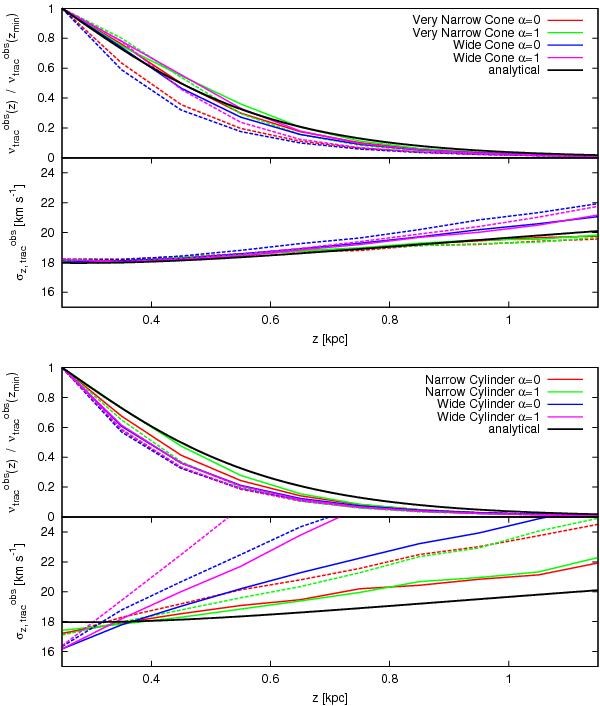
Changes of density fall-off and vertical velocity dispersion profiles of the tracers. Here we take into account the distance errors only. The line colors indicate results of different sampling regions and α. The solid and dashed lines indicate results of A = 0.3 and 0.5, respectively. Here we used mock data of one million tracer stars in all cases.
Current usage metrics show cumulative count of Article Views (full-text article views including HTML views, PDF and ePub downloads, according to the available data) and Abstracts Views on Vision4Press platform.
Data correspond to usage on the plateform after 2015. The current usage metrics is available 48-96 hours after online publication and is updated daily on week days.
Initial download of the metrics may take a while.