Fig. A.2
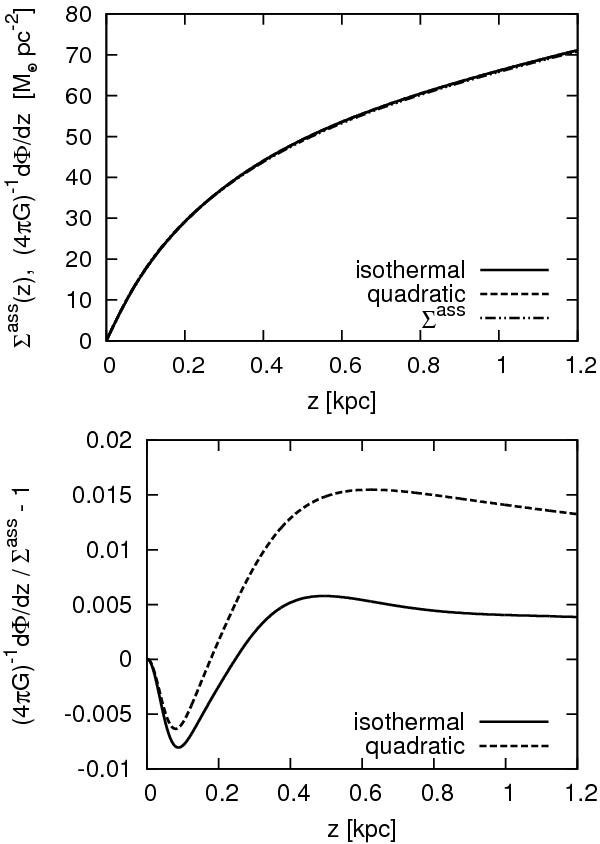
Comparison between surface densities deduced from the Jeans and Poisson equations (4πG)-1dΦ/dz and the density profile assumed in the model, Σass. The top panel indicates the surface density profiles. Since the three lines almost overlap, they may be indistinguishable by eye. The bottom panel shows fractional differences between the deduced surface density profiles and the assumed model.
Current usage metrics show cumulative count of Article Views (full-text article views including HTML views, PDF and ePub downloads, according to the available data) and Abstracts Views on Vision4Press platform.
Data correspond to usage on the plateform after 2015. The current usage metrics is available 48-96 hours after online publication and is updated daily on week days.
Initial download of the metrics may take a while.