Fig. 1
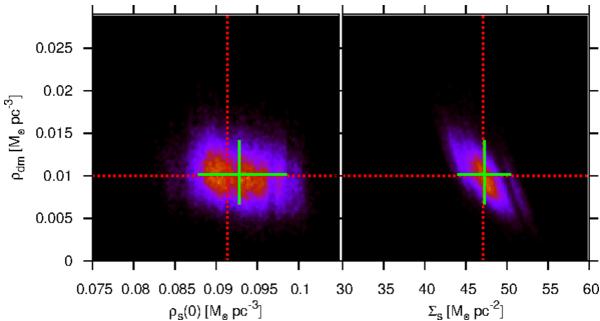
PDFs of LDMD, local and surface densities of all visible matters. Here, we adopt the analytical solutions of the tracer density and velocity dispersion profiles. The left and right panels illustrate the PDFs of LDMD vs. local and surface densities of the visible matters, respectively. The brighter regions mean higher probabilities. The green solid lines indicate the ranges of the 90% confidence levels, and their intersection points are the medians. The red dotted lines indicate the true values in the assumed model.
Current usage metrics show cumulative count of Article Views (full-text article views including HTML views, PDF and ePub downloads, according to the available data) and Abstracts Views on Vision4Press platform.
Data correspond to usage on the plateform after 2015. The current usage metrics is available 48-96 hours after online publication and is updated daily on week days.
Initial download of the metrics may take a while.