Fig. 2
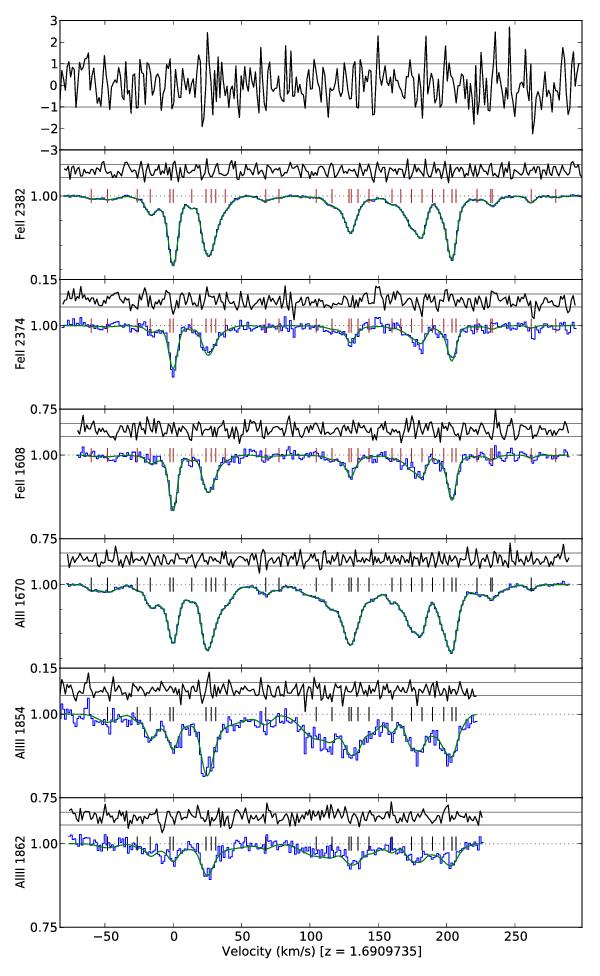
Transitions in absorption system at zabs = 1.6919 used to derive Δα/α in our second analysis approach. The Voigt profile model (green line) is plotted over the data (blue histogram). The velocity of each fitted component is marked with a vertical line, and the residuals between the data and model, normalized by the error spectrum, are shown above each transition. The top panel shows the composite residual spectrum − the mean spectrum of the normalized residuals for all transitions shown − in units of σ.
Current usage metrics show cumulative count of Article Views (full-text article views including HTML views, PDF and ePub downloads, according to the available data) and Abstracts Views on Vision4Press platform.
Data correspond to usage on the plateform after 2015. The current usage metrics is available 48-96 hours after online publication and is updated daily on week days.
Initial download of the metrics may take a while.