Fig. 1
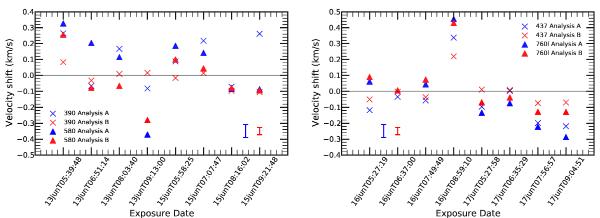
Radial velocity “slit shifts” between absorption lines in individual exposures and the same lines in the mean spectrum. Left panel: shifts for the 390 nm (crosses) and 580 nm (triangles) settings. Right panel: shifts for the 437 nm (crosses) and bluer chip of the 760 nm (triangles) settings. In both panels, blue points correspond to the first analysis approach and the red points correspond to the second analysis approach. Representative error bars for each analysis approach are shown in each panel.
Current usage metrics show cumulative count of Article Views (full-text article views including HTML views, PDF and ePub downloads, according to the available data) and Abstracts Views on Vision4Press platform.
Data correspond to usage on the plateform after 2015. The current usage metrics is available 48-96 hours after online publication and is updated daily on week days.
Initial download of the metrics may take a while.