Fig. 6
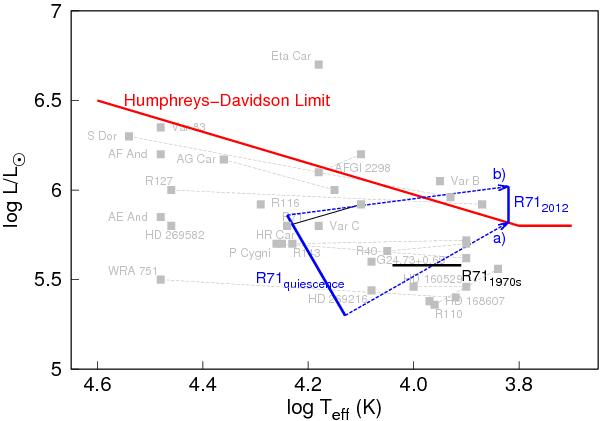
Schematic upper HR diagram. The red solid curve is the upper luminosity boundary. Confirmed LBVs (in the Galaxy, LMC, SMC, M31, and M33) and their transitions during outburst are displayed in gray. Values for L and T are retrieved mostly from van Genderen (2001), but for AG Car (Groh et al. 2009b), HR Car (Groh et al. 2009a), AFGl 2298 (Clark et al. 2003), G24.73+0.69 (Clark et al. 2005), WRA 751 (Sterken et al. 2008), and the M31 and M33 LBVs AE And, AF And, Var B, Var C, Var 83 (Szeifert et al. 1996). The positions of R71 during its quiescent state and its current eruption are indicated with blue solid curves. The lines do not imply variability but the range of loci permitted by the uncertainty of the reddening data and the bolometric correction. The dashed blue curves show the transitions for the lowest and highest extinction values found in the literature; (a) AV = 0.15 mag and (b) AV = 0.63 mag. R71’s 1970s outburst location is indicated in black.
Current usage metrics show cumulative count of Article Views (full-text article views including HTML views, PDF and ePub downloads, according to the available data) and Abstracts Views on Vision4Press platform.
Data correspond to usage on the plateform after 2015. The current usage metrics is available 48-96 hours after online publication and is updated daily on week days.
Initial download of the metrics may take a while.