Fig. 3
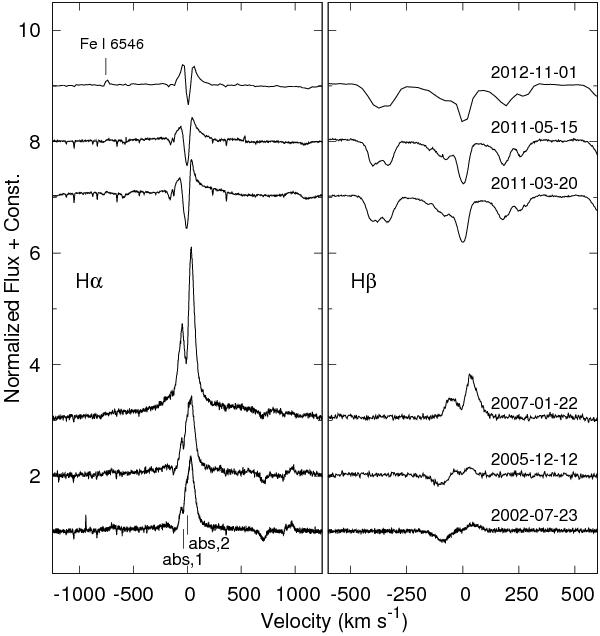
Hα and Hβ in R71 from 2002–2012. The Hα P Cyg profile changed to an inverse double-peaked symmetric profile during the eruptive state. The absorption component close to system velocity now dominates the profile. Hβ behaves similarly to Hα. In the latest spectrum from 2012 November, the Fe i λ6546 emission line becomes apparent toward the blue of Hα. The strong absorption features to the red and blue of Hβ in 2011–2012 are blends of Fe i, Ni i, Ti i, Ti ii absorption lines. (The continuum is normalized to unity, velocities are in R71’s restframe.)
Current usage metrics show cumulative count of Article Views (full-text article views including HTML views, PDF and ePub downloads, according to the available data) and Abstracts Views on Vision4Press platform.
Data correspond to usage on the plateform after 2015. The current usage metrics is available 48-96 hours after online publication and is updated daily on week days.
Initial download of the metrics may take a while.