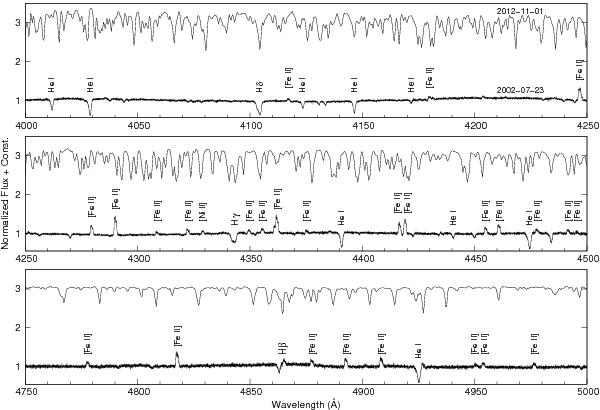
Fig. 2

Spectral variations between R71’s quiescent state in 2002 July (bottom spectrum) and its eruptive state in 2012 November (top spectrum). The 2002 UVES spectrum shows strong [Fe ii] emission. Hβ has a P Cyg profile, while higher Balmer lines and He i lines appear only in absorption. The 2012 X-shooter spectrum is dominated by strong metal absorption lines. (The continuum is normalized to unity. The wavelength region λλ4500–4750 Å is not displayed because of a gap in wavelength between the UVES blue and red settings.)
Current usage metrics show cumulative count of Article Views (full-text article views including HTML views, PDF and ePub downloads, according to the available data) and Abstracts Views on Vision4Press platform.
Data correspond to usage on the plateform after 2015. The current usage metrics is available 48-96 hours after online publication and is updated daily on week days.
Initial download of the metrics may take a while.


