Fig. 6
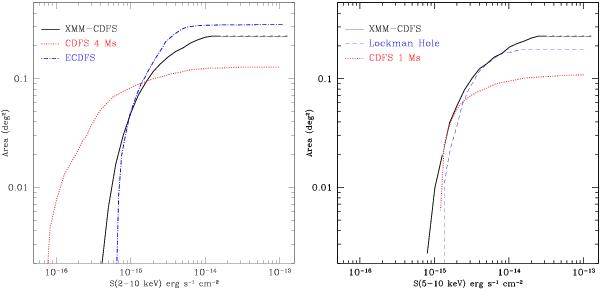
Coverage of the XMM-CDFS survey (solid black lines) in the 2 − 10 keV (left panel) and 5 − 10 keV band (right panel), defined as the fraction of simulated sources which were successfully detected as a function of their output flux, and normalized to the area probed by the catalogues. The dotted red lines show, for comparison, the same quantity for Chandra (left panel: 4 Ms survey, X11; right panel: 1 Ms survey, Rosati et al. 2002). The dashed blue line in the right panel shows the coverage for the XMM-Newton Lockman Hole (Brunner et al. 2008). We have not shown in the right panel the CDFS 4 Ms (Lehmer et al. 2012) since formally it is in a softer band (4 − 8 keV).
Current usage metrics show cumulative count of Article Views (full-text article views including HTML views, PDF and ePub downloads, according to the available data) and Abstracts Views on Vision4Press platform.
Data correspond to usage on the plateform after 2015. The current usage metrics is available 48-96 hours after online publication and is updated daily on week days.
Initial download of the metrics may take a while.