Fig. 12
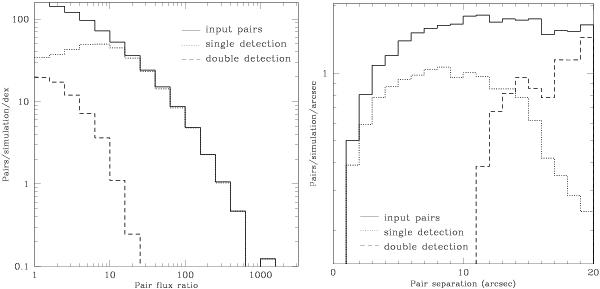
Left panel: number of pairs of sources, as function of the flux ratio between pairs of sources. Sources with fluxes 10 times fainter than the local (i.e. position-dependent) flux limits are included. Solid histogram: pairs of input sources. Dotted histogram: pairs detected as a single output source. Dashed histogram: pairs where both components have a detection. Right panel: number of pairs of sources, as function of the spatial separation between the two pair components. Line styles as in the left panel. Only pairs with flux ratios lower than 3, and whose components are brighter than 6.6 × 10⁻¹⁶ erg s-1 cm-2 are considered. The larger number of input pairs with respect to output ones in the 3′′ − 10′′ range is due to pairs where the distance between the centroid and the position of the detection is larger than 6″; this happens for ~3 sources per simulations.
Current usage metrics show cumulative count of Article Views (full-text article views including HTML views, PDF and ePub downloads, according to the available data) and Abstracts Views on Vision4Press platform.
Data correspond to usage on the plateform after 2015. The current usage metrics is available 48-96 hours after online publication and is updated daily on week days.
Initial download of the metrics may take a while.