Fig. 11
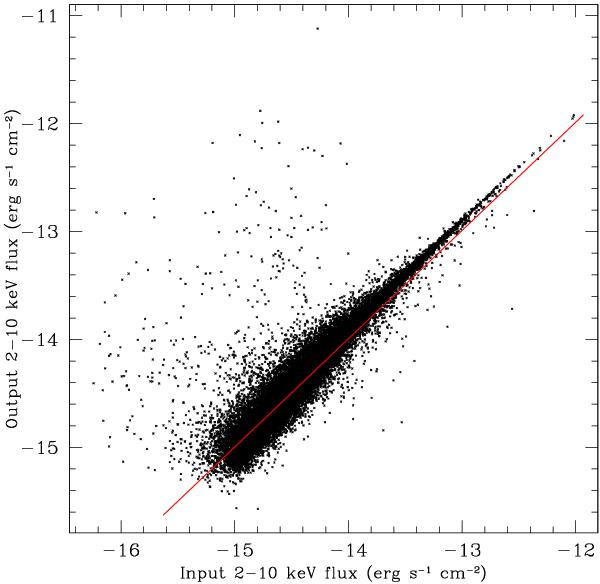
Input vs. output fluxes of the simulated sources, from 100 2 − 10 keV simulations. Only sources with a match within 6″ are considered. Some outliers are present, due to EMLDetect uncorrectly associating the source with extended emission especially in crowded regions, and for which we rather use the PWXDetect fluxes; the number of outliers is a few per simulation. The red line shows the identity relation. At bright fluxes ( ≳ 10-14 erg s-1 cm-2), the output values are about 20% larger than the input ones.
Current usage metrics show cumulative count of Article Views (full-text article views including HTML views, PDF and ePub downloads, according to the available data) and Abstracts Views on Vision4Press platform.
Data correspond to usage on the plateform after 2015. The current usage metrics is available 48-96 hours after online publication and is updated daily on week days.
Initial download of the metrics may take a while.