Free Access
Fig. 12
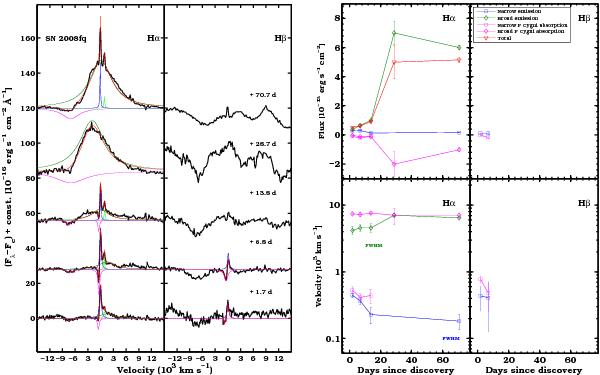
Left panel: Hα and Hβ profiles of SN 2008fq after low-order polynomial continuum subtraction and reddening correction. A combination of Lorentzians has been used to fit the profiles. Right panel: fluxes and velocities for the different Lorentzian components.
Current usage metrics show cumulative count of Article Views (full-text article views including HTML views, PDF and ePub downloads, according to the available data) and Abstracts Views on Vision4Press platform.
Data correspond to usage on the plateform after 2015. The current usage metrics is available 48-96 hours after online publication and is updated daily on week days.
Initial download of the metrics may take a while.