Fig. 7
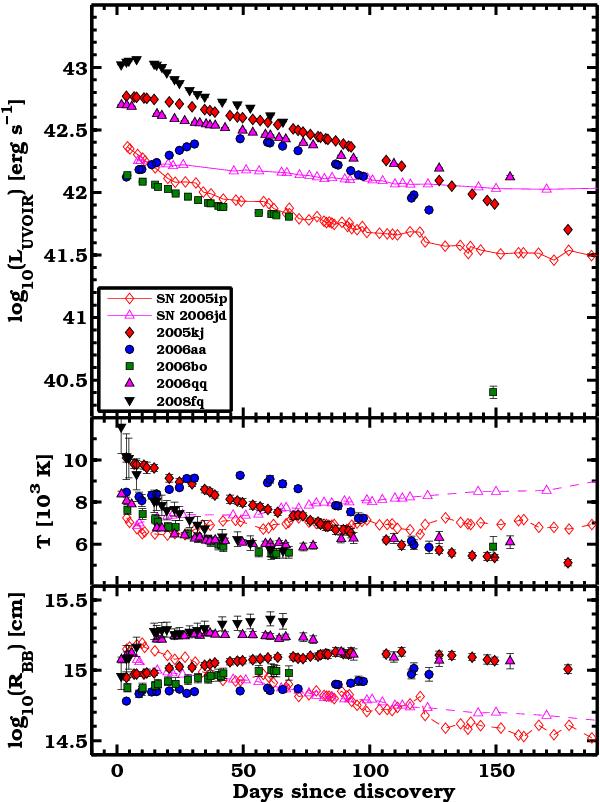
Top panel: UVOIR light curves for the full CSP SN IIn sample. Theoretical light curve tails powered by radioactive decay for different amounts of 56Ni are included as dashed lines. Middle panel: temperature evolution derived from BB fits to the time-series of SEDs. For SNe 2005ip and 2006jd we plot the temperature associated with the optical emission (see S12). Bottom panel: radius evolution was computed assuming BB emission. For SNe 2005ip and 2006jd, we plot the radius associated with the optical emission (see S12).
Current usage metrics show cumulative count of Article Views (full-text article views including HTML views, PDF and ePub downloads, according to the available data) and Abstracts Views on Vision4Press platform.
Data correspond to usage on the plateform after 2015. The current usage metrics is available 48-96 hours after online publication and is updated daily on week days.
Initial download of the metrics may take a while.