Free Access
Fig. 6
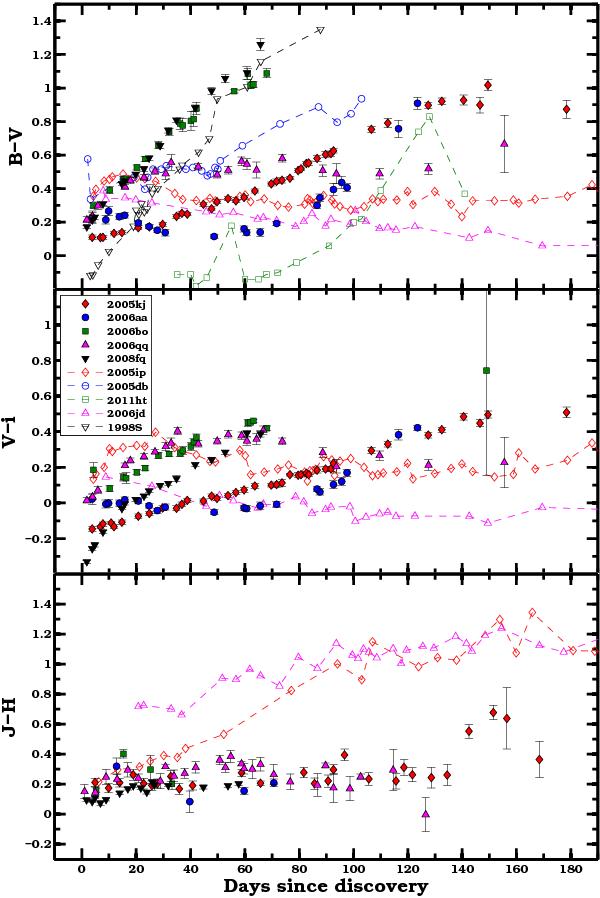
Intrinsic optical and NIR color-curve evolution of the CSP SNe IIn sample. The top panel B − V color curves also include several objects from the literature (see caption of Fig. 5 for references).
Current usage metrics show cumulative count of Article Views (full-text article views including HTML views, PDF and ePub downloads, according to the available data) and Abstracts Views on Vision4Press platform.
Data correspond to usage on the plateform after 2015. The current usage metrics is available 48-96 hours after online publication and is updated daily on week days.
Initial download of the metrics may take a while.