Free Access
Fig. 4
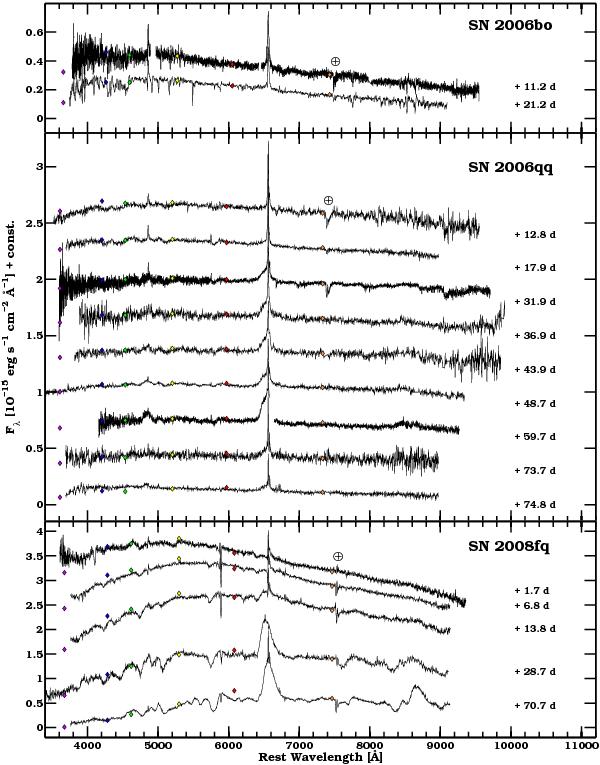
Spectroscopic sequences of SNe 2006bo, 2006qq and 2008fq. Days relative to the discovery epoch are reported next to each spectrum. Fluxes obtained from interpolated magnitudes at the epoch of each spectrum in each optical filter are marked by diamonds.
Current usage metrics show cumulative count of Article Views (full-text article views including HTML views, PDF and ePub downloads, according to the available data) and Abstracts Views on Vision4Press platform.
Data correspond to usage on the plateform after 2015. The current usage metrics is available 48-96 hours after online publication and is updated daily on week days.
Initial download of the metrics may take a while.