Fig. 15
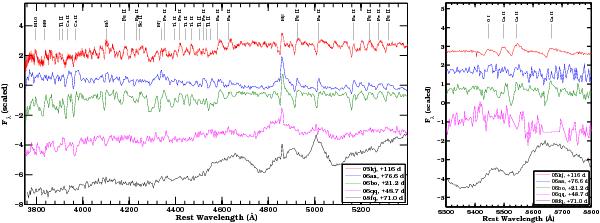
Left panel: spectral comparison of the five new CSP SNe IIn between wavelength 3800 and 5300 Å. Line identification is based on Kankare et al. (2012). In addition to Balmer lines, each spectrum is dominated by Fe ii and Ti ii features. Right panel: spectral comparison of the same objects in the wavelength region of the Ca ii NIR triplet.
Current usage metrics show cumulative count of Article Views (full-text article views including HTML views, PDF and ePub downloads, according to the available data) and Abstracts Views on Vision4Press platform.
Data correspond to usage on the plateform after 2015. The current usage metrics is available 48-96 hours after online publication and is updated daily on week days.
Initial download of the metrics may take a while.