Fig. 4
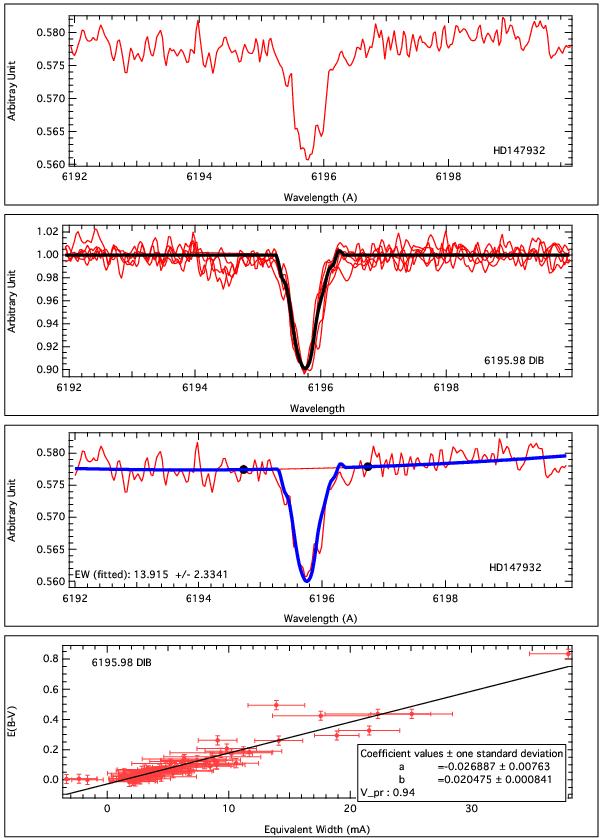
Illustration of the automated DIB fitting method for the 6196.0 DIB. The first row image shows the spectrum of HD 147932 (red line) with the DIB band at about 6195.98 Å. The second row image shows an empirical DIB shape model (black line). It is an average profile deduced from profiles of the most reddened stars, scaled to the same EW. The third row image shows an example of automated DIB fitting (DIB model + continuum fitting) The red line is the spectrum of target star and the blue line is the fitting result. The last row shows the correlation between EWs and color excess values using OLS method.
Current usage metrics show cumulative count of Article Views (full-text article views including HTML views, PDF and ePub downloads, according to the available data) and Abstracts Views on Vision4Press platform.
Data correspond to usage on the plateform after 2015. The current usage metrics is available 48-96 hours after online publication and is updated daily on week days.
Initial download of the metrics may take a while.