Free Access
Fig. 5
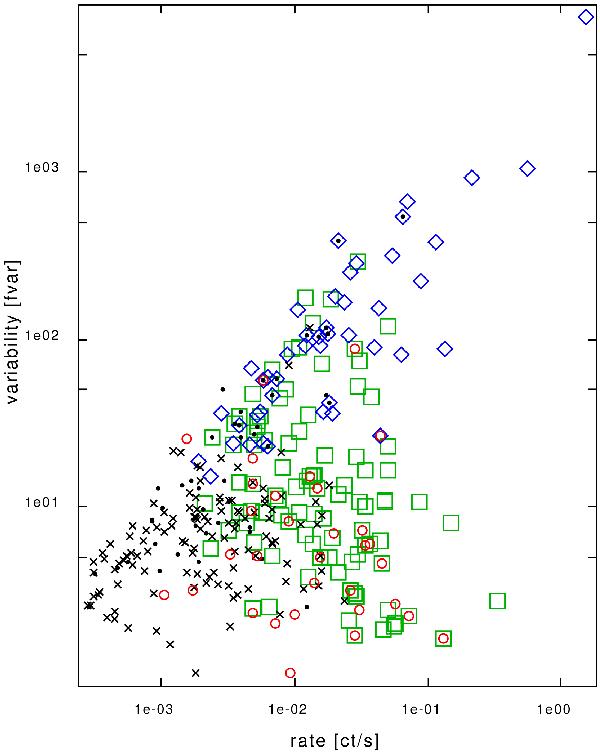
Population plot showing the source variability ratio fvar versus the highest photon count rate of a source. Blue diamonds are OBs, green squares are HVs, red circles are GlCs, black dots are novae, and black crosses are the remaining sources.
Current usage metrics show cumulative count of Article Views (full-text article views including HTML views, PDF and ePub downloads, according to the available data) and Abstracts Views on Vision4Press platform.
Data correspond to usage on the plateform after 2015. The current usage metrics is available 48-96 hours after online publication and is updated daily on week days.
Initial download of the metrics may take a while.