Fig. 11
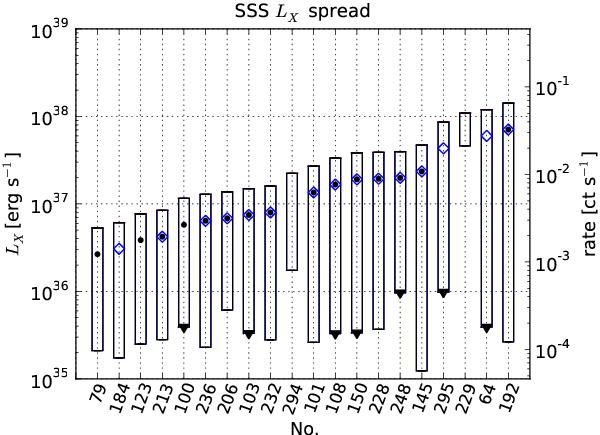
Variability plot showing the spread of luminosity (left y-axis) and count rate (right y-axis) for all OB or HV SSS or nova sources. The x-axis is labelled with the catalogue source number (No.). When the lowest count rate was derived from an upper limit of the light curve, the lower count rate is marked by a downward arrow. The blue diamonds mark the sources that are classified as OB sources in the catalogue. The black dots mark the sources that are associated to optical novae.
Current usage metrics show cumulative count of Article Views (full-text article views including HTML views, PDF and ePub downloads, according to the available data) and Abstracts Views on Vision4Press platform.
Data correspond to usage on the plateform after 2015. The current usage metrics is available 48-96 hours after online publication and is updated daily on week days.
Initial download of the metrics may take a while.