Fig. 4
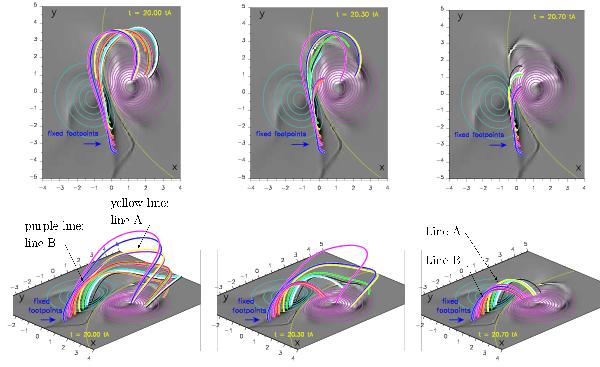
Flare loop formation via slip-running reconnection. Top and side views show a set of field lines drawn at t = 20,20.3,20.7 tA. The field lines are integrated at each time from the same set of footpoints (anchored at their respective coordinates F−). The panels show different locations of the moving footpoints within the positive magnetic polarity. The gray-scale image and the cyan/pink contourplots represent Jz(z = 0) and Bz(z = 0) as in Fig. 3a.
Current usage metrics show cumulative count of Article Views (full-text article views including HTML views, PDF and ePub downloads, according to the available data) and Abstracts Views on Vision4Press platform.
Data correspond to usage on the plateform after 2015. The current usage metrics is available 48-96 hours after online publication and is updated daily on week days.
Initial download of the metrics may take a while.