Fig. 9
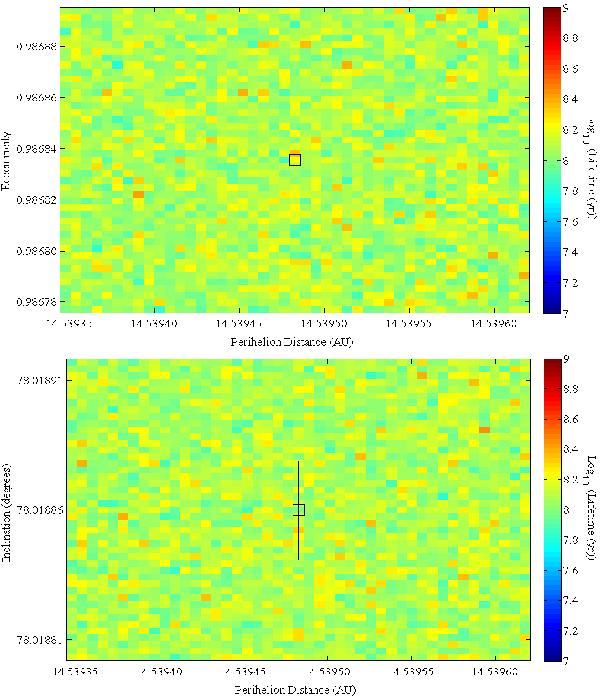
Upper panel: mean lifetime of clones of 2012 DR30, as a function of their initial perihelion distance and eccentricity. Each square of this plot shows the Log10 of the mean lifetime of all 45 test particles that began the simulations at that particular a–e coordinate. The hollow box shows the location of the nominal best-fit orbit for 2012 DR30, while the black lines that extend from that box show the 1-sigma errors in a and e for that best fit orbit. Lower panel: same as the upper panel but for inclination instead of eccentricity. We note that the stability of 2012 DR30 does not vary significantly as a function of the initial eccentricity or inclination and perihelion distance used, a reflection of the relatively high precision with which the objects orbit is known.
Current usage metrics show cumulative count of Article Views (full-text article views including HTML views, PDF and ePub downloads, according to the available data) and Abstracts Views on Vision4Press platform.
Data correspond to usage on the plateform after 2015. The current usage metrics is available 48-96 hours after online publication and is updated daily on week days.
Initial download of the metrics may take a while.