Fig. 8
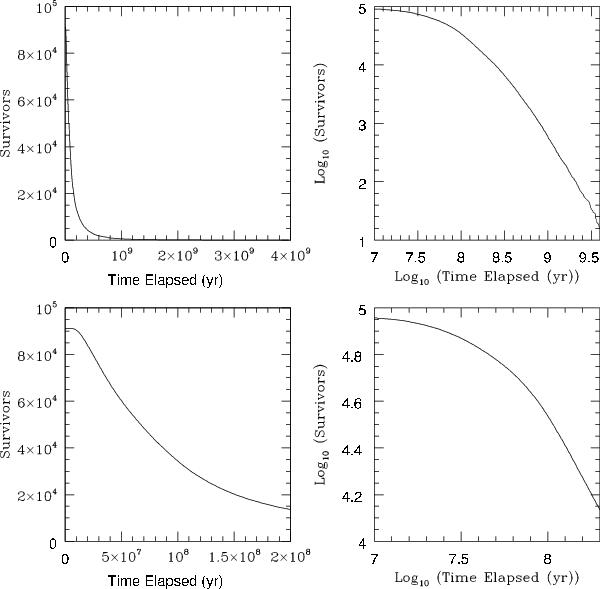
Decay of our population of 91 125 clones of 2012 DR30 as a function of time. The left-hand panels show the decay of the number of surviving clones as a function of time, whilst those to the right show the same data as log-log plots. The upper panels show the decay across the full 4 Gyr of our integrations, while the lower plots show just the first 200 Myr of the evolution of our test particles. It is immediately apparent that 2012 DR30 is moving on a dynamically highly unstable orbit, with fully half the test particles being ejected from the solar system within the first 75.5 Myr of the integrations. Such instability is not unexpected, given that 2012 DR30s orbit crosses those of Uranus and Neptune.
Current usage metrics show cumulative count of Article Views (full-text article views including HTML views, PDF and ePub downloads, according to the available data) and Abstracts Views on Vision4Press platform.
Data correspond to usage on the plateform after 2015. The current usage metrics is available 48-96 hours after online publication and is updated daily on week days.
Initial download of the metrics may take a while.