Fig. 6
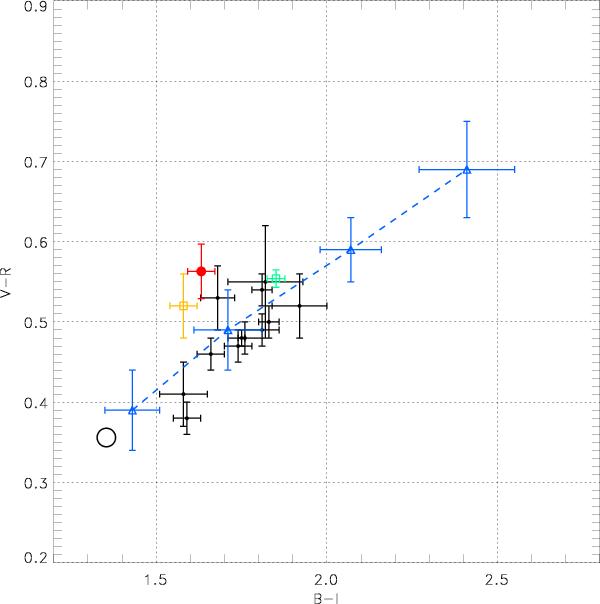
(B − I) versus (V − R) colours of 2012 DR30 (red filled circle with error bars) and some representative object types. Black data points represent the colours of some Damocloids by Jewitt (2005); blue triangles with errors bars correspond to the mean values of the BB,BR,RI and RR taxonomy classes of TNOs and Centaurs (Perna et al. 2010), from bottom-left to top-right, respectively; the green and orange points show the median colours of the olivine bearing S-type and V-tpye asteroids, respectively (Chapman et al. 1993). The big black open circle marks the solar colours (Ramírez et al. 2012). The erros bars of the individual Damocloid points correspond to the errors of the colour determination (Jewitt 2005) while in the case of the taxonomy class median values they represent the standard deviation of the distribution.
Current usage metrics show cumulative count of Article Views (full-text article views including HTML views, PDF and ePub downloads, according to the available data) and Abstracts Views on Vision4Press platform.
Data correspond to usage on the plateform after 2015. The current usage metrics is available 48-96 hours after online publication and is updated daily on week days.
Initial download of the metrics may take a while.