Fig. 4
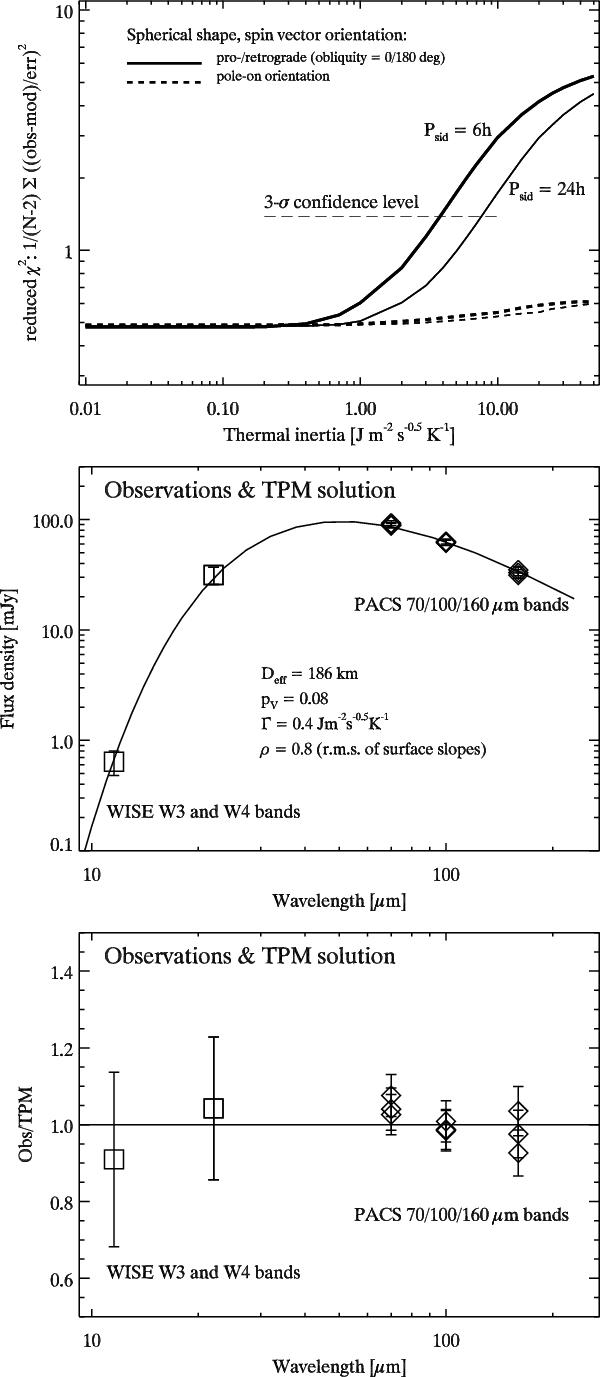
a) TPM analysis of all available thermal measurements. The reduced χ2-values are shown for two different spin vector orientations: equator-on (solid lines) and pole-on (dashed lines), each time for two different values for the rotation period. The 3-σ confidence level for the TPM fit to the observations is also shown; b) the best TPM solution is shown together with the observed fluxes; c) the same model, but now shown in the observation/TPM picture.
Current usage metrics show cumulative count of Article Views (full-text article views including HTML views, PDF and ePub downloads, according to the available data) and Abstracts Views on Vision4Press platform.
Data correspond to usage on the plateform after 2015. The current usage metrics is available 48-96 hours after online publication and is updated daily on week days.
Initial download of the metrics may take a while.