Fig. 4
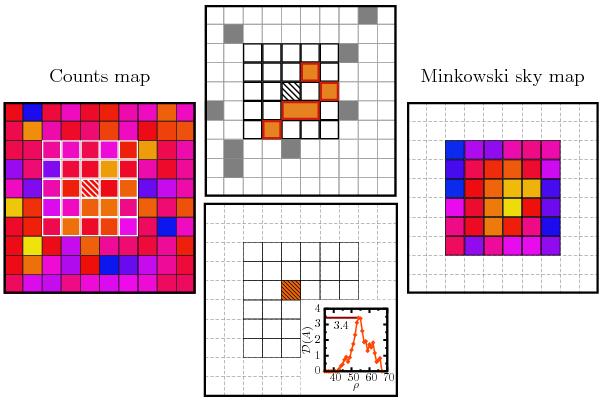
Computation of a Minkowski sky map. Left: a given counts map. Middle: for each pixel the local structure within the sliding window is characterized (top) and the maximum deviation strength for all thresholds is assigned to it in the Minkowski sky map (bottom). Right: iterating through all pixels provides the Minkowski sky map.
Current usage metrics show cumulative count of Article Views (full-text article views including HTML views, PDF and ePub downloads, according to the available data) and Abstracts Views on Vision4Press platform.
Data correspond to usage on the plateform after 2015. The current usage metrics is available 48-96 hours after online publication and is updated daily on week days.
Initial download of the metrics may take a while.