Fig. 4
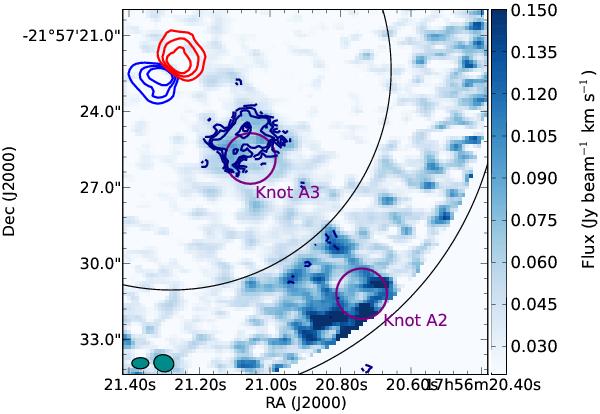
CO J = 3–2 integrated intensity map of the blue shifted wind from HD 163296. The colourscale shows the primary beam corrected integrated intensity of the J = 3–2 emission The black, blue and red circles and contours are the same as Fig. 2. The molecular counterpart to HH knot A2 is more prominent in this image because we have corrected for the fall-off in sensitivity as a function of distance from the pointing centre.
Current usage metrics show cumulative count of Article Views (full-text article views including HTML views, PDF and ePub downloads, according to the available data) and Abstracts Views on Vision4Press platform.
Data correspond to usage on the plateform after 2015. The current usage metrics is available 48-96 hours after online publication and is updated daily on week days.
Initial download of the metrics may take a while.