Fig. 1
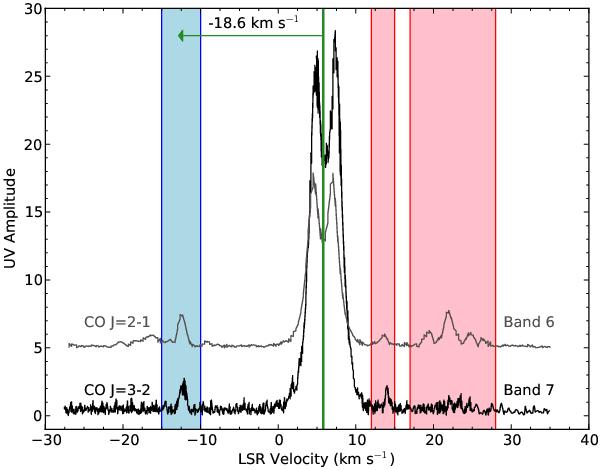
Visibility spectra averaging over the two shortest baselines in each of the Band 6 and Band 7 datasets showing the blue and red shifted wind emission in this field of view. The rest velocity of the source is 5.8 km s-1 (Hughes et al. 2008) as shown with a green line in the plot. The Band 6 (CO J = 2–1) data have been shifted upwards by 5 to clearly show both spectra.
Current usage metrics show cumulative count of Article Views (full-text article views including HTML views, PDF and ePub downloads, according to the available data) and Abstracts Views on Vision4Press platform.
Data correspond to usage on the plateform after 2015. The current usage metrics is available 48-96 hours after online publication and is updated daily on week days.
Initial download of the metrics may take a while.