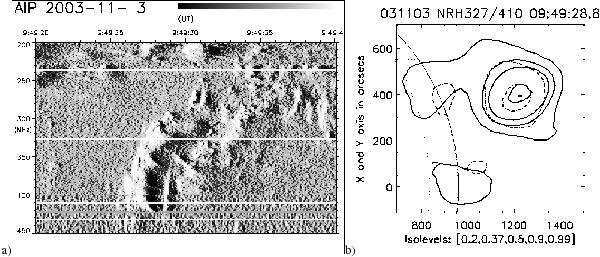
Fig. 8

Interval (2) of Fig. 2. a) The dynamic spectrum. White lines denote the NRH frequencies. b) 327 (continuous contour) and 410.5 MHz (dash-dot contour) at 09:49:28.8 UT (all normalized as before). The upper source flux dominates, all frequencies coincide, all source sites are slightly displaced with the higher frequency (density) nearer to the flare site. The 432 MHz source flux is below the 20% level.
Current usage metrics show cumulative count of Article Views (full-text article views including HTML views, PDF and ePub downloads, according to the available data) and Abstracts Views on Vision4Press platform.
Data correspond to usage on the plateform after 2015. The current usage metrics is available 48-96 hours after online publication and is updated daily on week days.
Initial download of the metrics may take a while.


