Free Access
Fig. 5
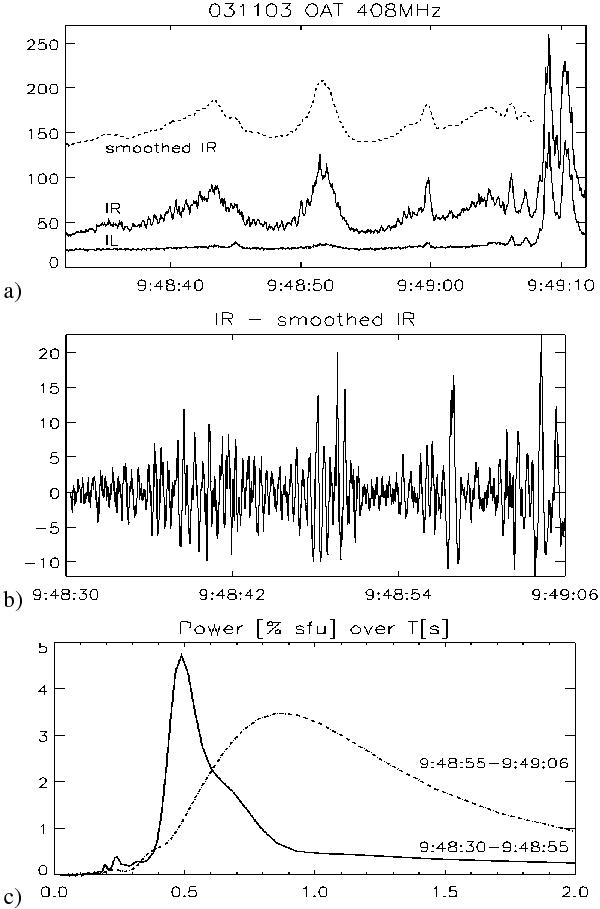
OAT 408 MHz data. a) IR and IL. The dashed curve (smoothed IR) is raised to avoid overlap. b) The fast pulsations in IR. We note that the time axes of a) and b) are different; the y-axis is in sfu (1 s.f.u. = 10-22 Ws m-2). c) The power spectrum of two segments of b). The 0.5 s period is sharply defined.
This figure is made of several images, please see below:
Current usage metrics show cumulative count of Article Views (full-text article views including HTML views, PDF and ePub downloads, according to the available data) and Abstracts Views on Vision4Press platform.
Data correspond to usage on the plateform after 2015. The current usage metrics is available 48-96 hours after online publication and is updated daily on week days.
Initial download of the metrics may take a while.