Fig. 1
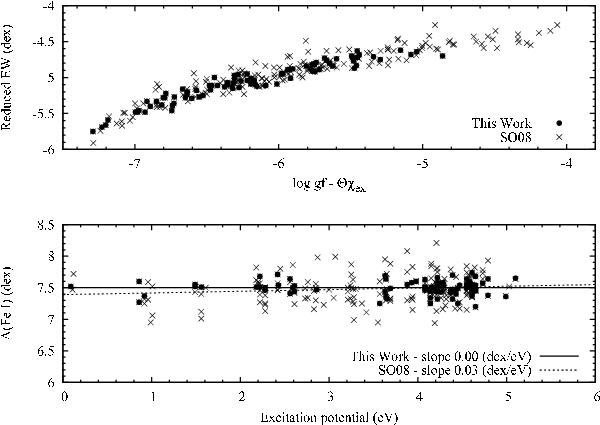
Upper panel: curve of growth for both line lists for the reference star computed for the temperature (Θ = 5040/Teff) of this work. Circles represent the reduced EW of the line list of this work and crosses the line list of SO08. Lower panel: the Fe i abundances of the reference star versus the excitation potential. The dashed line shows the positive slope that corresponds to the line list of SO08. The solid line corresponds to the line list of this work and the slope is obviously zero.
Current usage metrics show cumulative count of Article Views (full-text article views including HTML views, PDF and ePub downloads, according to the available data) and Abstracts Views on Vision4Press platform.
Data correspond to usage on the plateform after 2015. The current usage metrics is available 48-96 hours after online publication and is updated daily on week days.
Initial download of the metrics may take a while.