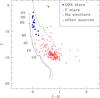
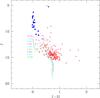
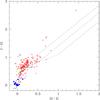
Fig. 10
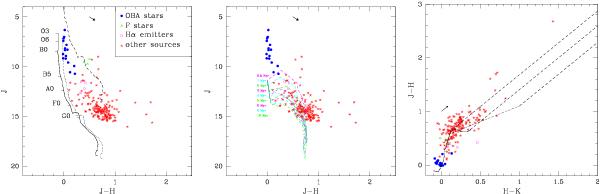
Same as Fig. 6 for IC 2944/2948. Left: the dashed line corresponds to the main sequence shifted for a distance of 150 pc and for a reddening of E(B − V) = 0.35 mag, the solid and dotted lines correspond to the main sequences for a distance of 2.3 kpc, typical of the cluster (Sana et al. 2011), without and with correction for the cluster’s absorption (E(B − V) = 0.32 mag, RV = 3.1, see McSwain & Gies 2005b), respectively. Middle: the same color−magnitude diagram with the Siess et al. (2000) isochrones, shifted for a distance of 2.3 kpc and E(B − V) = 0.32 mag, superimposed as dashed lines. Right: color−color diagram for the same objects (using RV = 3.1). The color version of this figure is available online.
Current usage metrics show cumulative count of Article Views (full-text article views including HTML views, PDF and ePub downloads, according to the available data) and Abstracts Views on Vision4Press platform.
Data correspond to usage on the plateform after 2015. The current usage metrics is available 48-96 hours after online publication and is updated daily on week days.
Initial download of the metrics may take a while.