Fig. 6
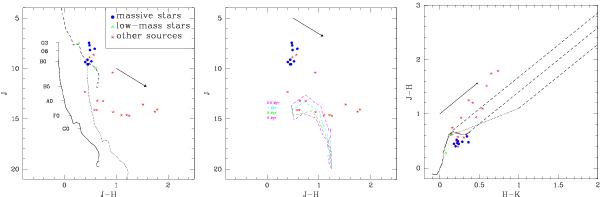
Left: color−magnitude diagram for non-spurious X-ray sources in HM1 having reliable 2MASS counterparts. The dashed line corresponds to the main sequence shifted for a distance of 92 pc (that of HD 156301), the solid and dotted lines correspond to the main sequences for a DM = 12.6 mag, typical of the cluster (Vázquez & Baume 2001), without and with correction for the cluster’s absorption (E(B − V) = 1.84 mag,RV = 3.3, see Vázquez & Baume 2001), respectively. The main sequence magnitudes and colors are taken from Martins & Plez (2006) for O-stars (masses >15 M⊙) and Tokunaga (2000) for the other spectral types (masses in the range 0.1−15 M⊙). The reddening vector corresponds to the reddening expected for the cluster. Middle: the same color−magnitude diagram with Siess et al. (2000) isochrones, for DM = 12.6 mag and E(B − V) = 1.84 mag, superimposed as dashed lines. The displayed tracks correspond to masses in the range 0.1−7.0 M⊙ (spectral types M6 to B3). Right: color−color diagram for the same objects. The dotted line shows the intrinsic (i.e., dereddened) colors of classical T Tauri stars (Meyer et al. 1997), the dashed lines correspond to increasing values of absorption (using RV = 3.3 and Cardelli et al. 1989 extinction law) for the blue and red limits of the main sequence for low-mass stars and of the TTs sequence. Note that for these figures the 2MASS JHK photometry was transformed into the Bessel & Brett system (see http://www.astro.caltech.edu/~jmc/2mass/v3/transformations/). The color version of this figure is available online.
Current usage metrics show cumulative count of Article Views (full-text article views including HTML views, PDF and ePub downloads, according to the available data) and Abstracts Views on Vision4Press platform.
Data correspond to usage on the plateform after 2015. The current usage metrics is available 48-96 hours after online publication and is updated daily on week days.
Initial download of the metrics may take a while.