Fig. 5
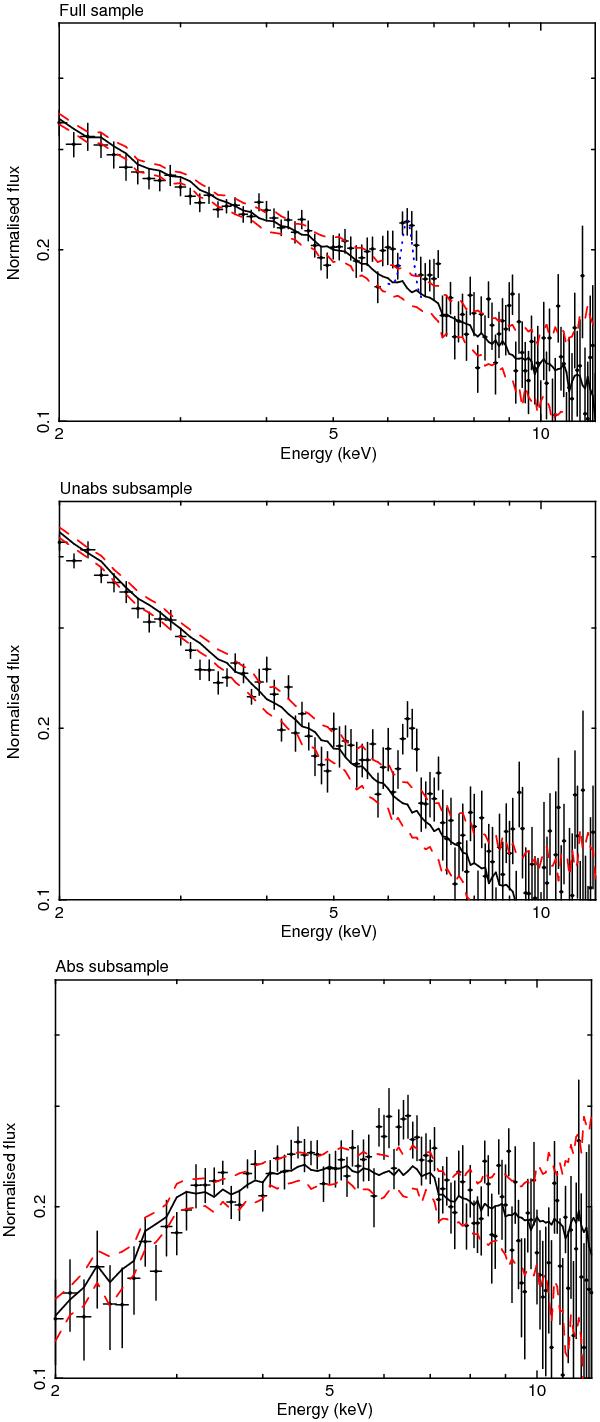
Average observed spectrum (data points) with its simulated continuum (continuous line) and the 1σ confidence levels of our simulations (dashed lines). From top to bottom: full sample, Unabs subsample, Abs subsample. The dotted line in the top panel represents the intrinsic resolution at 6.4 keV obtained from the simulations of the iron line described in Sect. 3.3.

Current usage metrics show cumulative count of Article Views (full-text article views including HTML views, PDF and ePub downloads, according to the available data) and Abstracts Views on Vision4Press platform.
Data correspond to usage on the plateform after 2015. The current usage metrics is available 48-96 hours after online publication and is updated daily on week days.
Initial download of the metrics may take a while.