Fig. 6
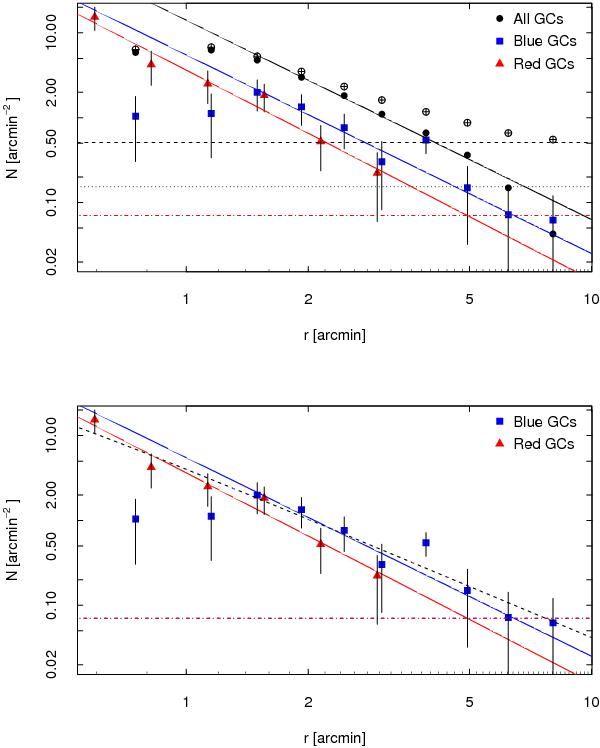
Upper panel: raw radial distribution for all GC candidates (open circles). Background-corrected distributions for GC candidates with 1 < (C − T1)0 < 2.3 (filled black circles) and for the blue (blue squares) and red (red triangles) samples. The solid lines represent power laws (see text) for the respective samples corresponding by colour. The dashed line indicates the background level, while the dotted one refers to the 30% of the background level. The dash-dotted line is the 30% of the background level for the blue and red samples, which are indistinguishable. Lower panel: dashed line indicates the Hubble-Reynolds profile of NGC 7507 by Salinas et al. (2012).
Current usage metrics show cumulative count of Article Views (full-text article views including HTML views, PDF and ePub downloads, according to the available data) and Abstracts Views on Vision4Press platform.
Data correspond to usage on the plateform after 2015. The current usage metrics is available 48-96 hours after online publication and is updated daily on week days.
Initial download of the metrics may take a while.