Free Access
Fig. 5
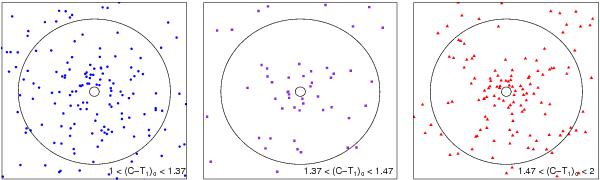
Projected spatial distribution of GC candidates, separated into three different colour bins. The circles plotted in each panel refer to the selected radial regime for the analysis (i.e. 0.5′ < R < 7′). Each figure spans 15.75′ × 15.75′. North is up, east to the left.
Current usage metrics show cumulative count of Article Views (full-text article views including HTML views, PDF and ePub downloads, according to the available data) and Abstracts Views on Vision4Press platform.
Data correspond to usage on the plateform after 2015. The current usage metrics is available 48-96 hours after online publication and is updated daily on week days.
Initial download of the metrics may take a while.