Free Access
Fig. 4
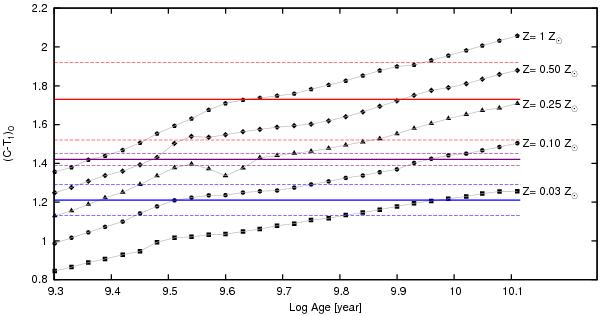
Theoretical models of single stellar populations by Bressan et al. (2012) for five different metallicities (filled symbols). Blue, violet, and red solid lines indicate the mean colours of the three GC groups, while dashed lines indicate their dispersions.
Current usage metrics show cumulative count of Article Views (full-text article views including HTML views, PDF and ePub downloads, according to the available data) and Abstracts Views on Vision4Press platform.
Data correspond to usage on the plateform after 2015. The current usage metrics is available 48-96 hours after online publication and is updated daily on week days.
Initial download of the metrics may take a while.