Free Access
Fig. 3
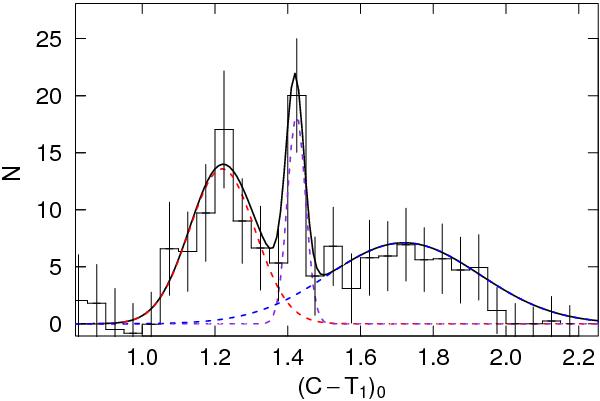
Background-corrected colour distribution for GC candidates in the radial regime 0.5′ < R < 7′. A sum of three Gaussians has been fitted and is plotted as solid black lines, while each individual Gaussian is plotted as dashed lines. We interpret the sharp peak at (C − T1) = 1.4 as the signature of a starburst.
Current usage metrics show cumulative count of Article Views (full-text article views including HTML views, PDF and ePub downloads, according to the available data) and Abstracts Views on Vision4Press platform.
Data correspond to usage on the plateform after 2015. The current usage metrics is available 48-96 hours after online publication and is updated daily on week days.
Initial download of the metrics may take a while.