Free Access
Fig. 1
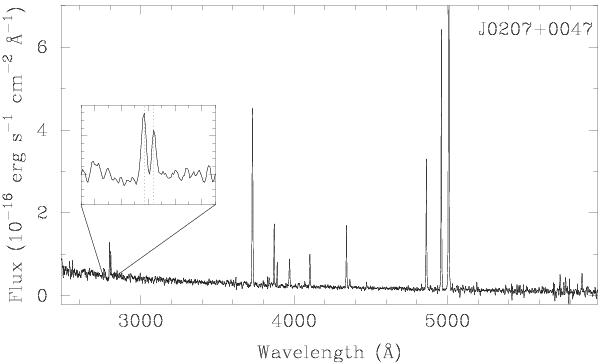
Redshift-corrected SDSS spectrum of J0207+0047. The spectral region λλ2750–2850, which includes the Mg iiλ2797, λ2803 emission lines, is shown in the inset. Vertical dotted lines in the inset indicate the nominal wavelengths of the lines.
Current usage metrics show cumulative count of Article Views (full-text article views including HTML views, PDF and ePub downloads, according to the available data) and Abstracts Views on Vision4Press platform.
Data correspond to usage on the plateform after 2015. The current usage metrics is available 48-96 hours after online publication and is updated daily on week days.
Initial download of the metrics may take a while.